21st Century Journalism XXXIII: Media Cloud
The Berkman Center for Internet & Society has just launched its open-source Media Cloud system. As explained at the website,Media Cloud is a system that lets you see the flow of the media. ... Media Cloud automatically builds an archive of news stories and blog posts from the Web, applies language processing, and gives you ways to analyze and visualize the data.The idea is to answer such questions as:
- What types of stories are covered by which media sources?
- Where do particular news stories begin?
- What areas of the world garner attention, and which do not?
- How does the blogosphere's coverage of an issue compare to the mainstream media's?
- What role do comments and other participatory channels on the Web play in setting the news or political agenda?
At the moment, only three types of visualization of a media source's news coverage are available. You can compare up to three sources at a time.
The three chart types are:
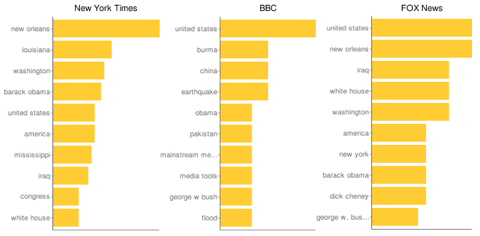
- A bar chart showing the ten terms used most frequently in each of your chosen sources. The image below is an example.
- A bar chart showing, for a prominent person, place, or event you select, the ten terms used most frequently in each of your chosen sources. The image below is an example. It shows the top 10 phrases used by the New York Times, the BBC, and Fox News in stories, from the past six months, that referenced "Katrina."
- A world map for each media source in which countries are shaded according to how heavily the source covers them. The image below is an example.


Labels: Journalism, Taxonomy and tagging
<< Home