The Power Mapping Tool
An exemplary approach to figuring out how to promote effective implementation of third-world development programs is described in a 2007 discussion paper posted online by the International Food Policy Research Institute (IFPRI). (Another of IFPRI's discussion papers was the subject of yesterday's post.)In "The Power Mapping Tool: A Method for the Empirical Research of Power Relations," Eva Schiffer, a post-doctoral fellow at IFPRI, describes a practical approach to "empirical measurement of power in governance processes."
The problem the Power Mapping Tool helps address is the perennial difficulty in getting technically sound economic development interventions implemented in a way that actually accomplishes their goals. For example, all too often, development assistance intended for the poorest segment of a country's population ends up in the hands of the country's relatively well-off, a phenomenon referred to in the development literature as "elite capture."
The Power Mapping Tool seeks to bolster effective implementation by determining in advance, or as implementation proceeds, the power structure within which a program is being carried out. With this information in hand, implementation can be adjusted to maximize positive contributions of various actors, while minimizing dysfunctional influences.
The Power Mapping Tool involves interviewing individuals with first-hand knowledge of a program's governance context. The interviewees answer three basic questions:
Who is involved?
What is each actor's range of action?
How much power does each actor have?
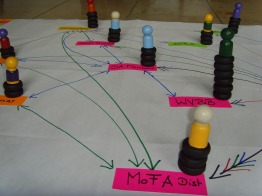
To elicit complete, meaningful answers to these questions, the Power Mapping Tool adopts a set-up resembling a board game.
As illustrated in the photo below, the Who question is answered by assigning each actor a playing piece. The actors are placed in ovals representing the various organizational bodies involved in implementation. When an actor is a participant in more than one organization, this is captured by having the corresponding ovals overlap.

The range-of-action question is answered by having the intervieweee assign up to four types of playing card to each actor. The four types of cards bear symbols representing, respectively:
- Observing
- Giving advice
- Making decisions
- Providing funding
The Power Mapping Tool produces both quantitative and qualitative information. The latter is obtained through discussing with the interviewee the thinking behind his/her answers to the Who, range-of-action, and amount-of-power questions.
I highly recommend reading Schiffer's entire paper (21 pages). Then, as a next step, you can look at the Net-Map toolbox Schiffer has developed to integrate power mapping and social network mapping (see illustration below).
Labels: Africa, Documentation, Networking, Systems thinking
posted by Karen Nelson @ 11:10 PM
![]()
![]()
<< Home